Talking Points:
US Dollar Steadily Grinding Through Resistance Levels
S&P 500 Within Striking Distance of 1900 Once Again
Crude Oil Stalls Near $104, Gold Continues to Flat-Line
Can’t access to the Dow Jones FXCM US Dollar Index? Try the USD basket on Mirror Trader. **
US DOLLAR TECHNICAL ANALYSIS – Prices appear to have set a major double bottom at 10375, the October 2013 bottom. An upward trend change is being hinted by a break above resistance at the top of a falling channel that had guided the downward trajectory since the beginning of the year. Resistance is in the 10474-95 area, with a break above that clearing the way for a move to challenge the 10589-619 region. The channel top, now at 10446, has been recast as near-term support.
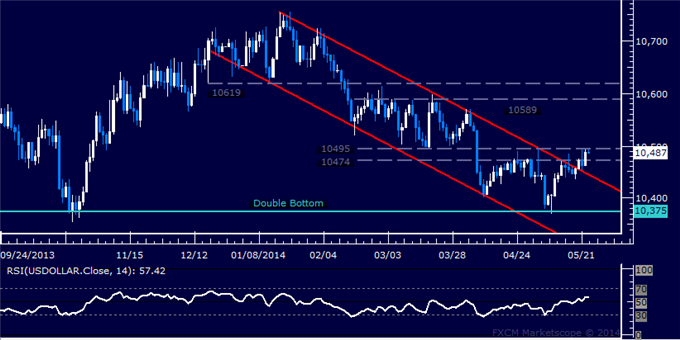
Daily Chart – Created Using FXCM Marketscope 2.0
** The Dow Jones FXCM US Dollar Index and the Mirror Trader USD basket are not the same product.
S&P 500 TECHNICAL ANALYSIS – Prices broke resistance in the in the 1883.80-88.60 region, bracketed by the March 7 high and the 23.6% Fibonacci expansion. The bulls now aim to challenge of the 1897.40-1899.10 zone, the site of the 38.2% level and the April 4 peak, with a break above that exposing the 50% Fib at 1908.40. Alternatively, a move back below 1883.80 targets a rising trend line set from late April, now at 1869.50.
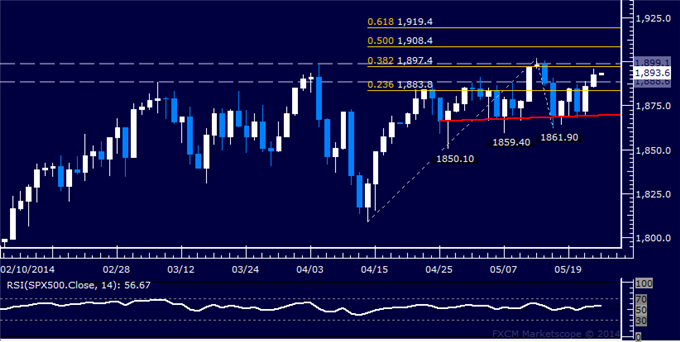
Daily Chart – Created Using FXCM Marketscope 2.0
GOLD TECHNICAL ANALYSIS – Prices are consolidating below resistance in the 1303.89-15.60 area, marked by the top of a descending Triangle chart formation and the 38.2% Fibonacci retracement. A break above that on daily closing basis targets the 50% level at 1330.18. The descending Triangle argues in favor of bearish continuation however (though confirmation is absent for now). Near-term support is at 1277.00, the Triangle bottom.
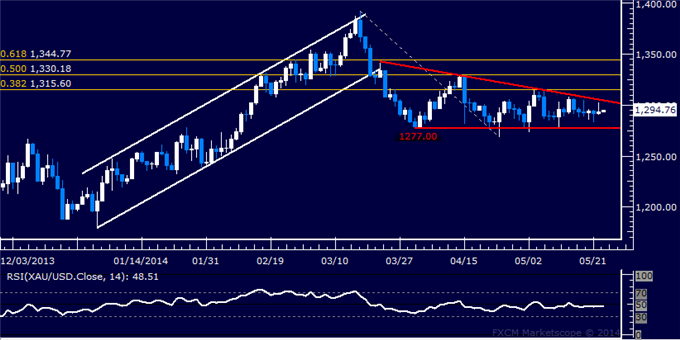
Daily Chart – Created Using FXCM Marketscope 2.0
CRUDE OIL TECHNICAL ANALYSIS – Prices are testing resistance at 104.24, the 76.4% Fibonacci expansion. A break above this barrier initially exposes the 100% level at 105.16. Near-term support is at 103.67, the 61.8% Fib, with a move back below that eyeing the 50% expansion at 103.20.

Daily Chart – Created Using FXCM Marketscope 2.0
— Written by Ilya Spivak, Currency Strategist for DailyFX.com
To receive Ilya’s analysis directly via email, please SIGN UP HERE
Contact and follow Ilya on Twitter: @IlyaSpivak
Crude Oil Stalls Near 104 Level, SPX 500 Poised to Test 1900 Again
No comments:
Post a Comment