Talking Points:
US Dollar Has Erased Nearly Half of Its Year-to-Date Drop
S&P 500 Turns Aggressively Lower After Topping Sub-2000
Crude Oil Hits New 4-Month Low as Sharp Selloff Continues
Can’t access the Dow Jones FXCM US Dollar Index? Try the USD basket on Mirror Trader. **
US DOLLAR TECHNICAL ANALYSIS – Prices broke above yet another layer of resistance after reversing upward as expected having put in a Bullish Engulfing candle pattern. Near-term resistance is at 10560, the 50% Fibonacci retracement. A daily close above that exposes 61.8% level at 10606. Alternatively, a turn back below the May 28 high at 10531 opens clears the way for a test of the 38.2% Fib at 10513.
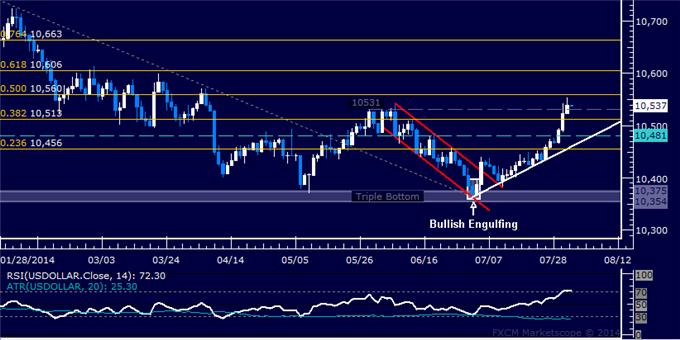
Daily Chart – Created Using FXCM Marketscope 2.0
** The Dow Jones FXCM US Dollar Index and the Mirror Trader USD basket are not the same product.
S&P 500 TECHNICAL ANALYSIS – Prices turned lower as expected after putting in a bearish Evening Star candlestick pattern bolstered by negative RSI divergence. Sellers now aim to challenge the 38.2% Fibonacci retracement at 1921.80, with a break below that on a daily closing basis exposing the 50% level at 1900.30. Alternatively, a reversal above the 23.6% Fib at 1948.40 clears the way for a challenge of the 14.6% retracement at 1964.80.
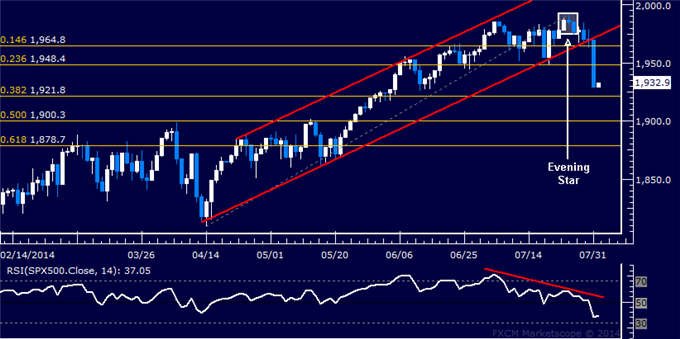
Daily Chart – Created Using FXCM Marketscope 2.0
GOLD TECHNICAL ANALYSIS – Prices are drifting cautiously lower having topped below $1350/oz three weeks ago. Near-term support is in the 1281.38-87.13 area, marked by a falling trend line set from late June and the 38.2% Fibonacci expansion. A break below that on a daily closing basis exposes the 50% level at 1269.22. Alternatively, a reversal above the 23.6% Fib at 1309.20 eyes the 14.6% expansion at 1322.94.
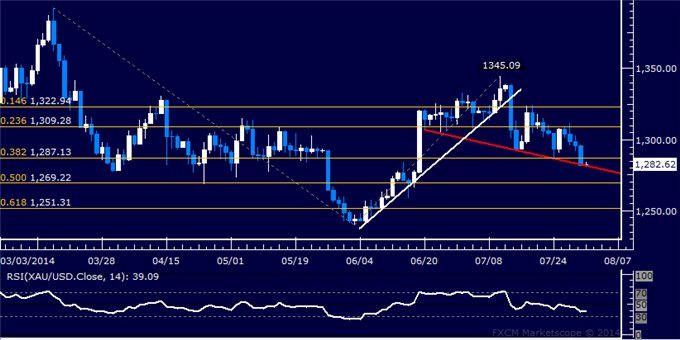
Daily Chart – Created Using FXCM Marketscope 2.0
CRUDE OIL TECHNICAL ANALYSIS – Prices continue to race downward, with sellers now aiming to challenge the 76.4% Fibonacci expansion at 97.30. A break below that on a daily closing basis exposes a rising trend line set from June 2012, now at 96.28. Alternatively, a reversal above the 61.8% level at 98.56 aims for the 50% Fib at 99.58.
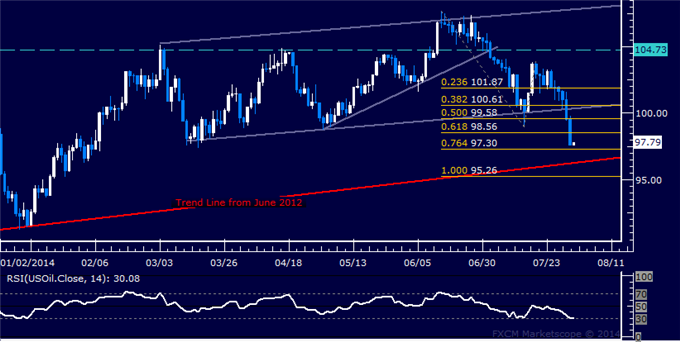
Daily Chart – Created Using FXCM Marketscope 2.0
— Written by Ilya Spivak, Currency Strategist for DailyFX.com
To receive Ilya’s analysis directly via email, please SIGN UP HERE
Contact and follow Ilya on Twitter: @IlyaSpivak
Crude Oil Drops to 4-Month Low, SPX 500 Turns Lower as Expected
No comments:
Post a Comment