Talking Points
USD/JPY attempting to breakout
S&P 500 nearing important downside pivot
Important developments on the monthly FXCM Dollar Index chart
Get real time volume on your charts for free. Click HERE
Foreign Exchange Price & Time at a Glance:
Price & Time Analysis: USD/JPY
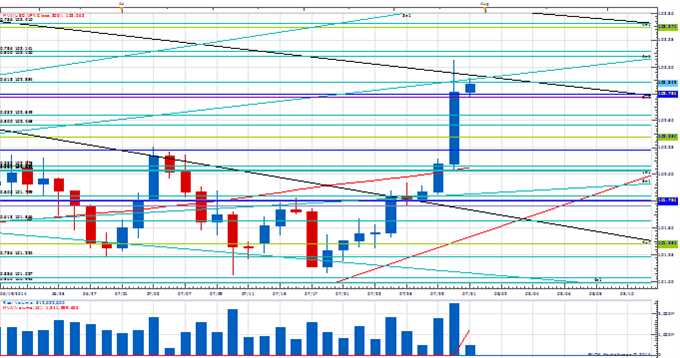
Charts Created using Marketscope – Prepared by Kristian Kerr
USD/JPY traded to its highest level yesterday since the start of April
Our near-term trend bias is higher in USD/JPY while above 101.05
The 61.8% retracement of the April/May decline at 102.85 needs to be overcome to ease doubts of a false of break
A very minor cycle turn window is eyed early next week
Interim support is seen around 101.75, but only aggressive weakness under 101.05 would turn us negative on the exchange rate.
USD/JPY Strategy: Like the long side while over 101.05.
Price & Time Analysis: S&P 500
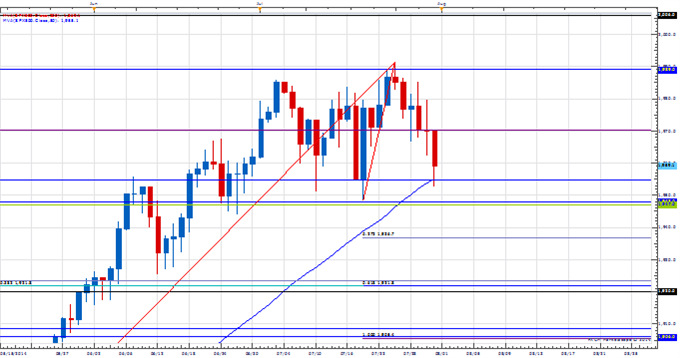
Charts Created using Marketscope – Prepared by Kristian Kerr
S&P 500 has chopped around since the important cycle turn window around the middle of the month (notably the Dow peaked during this window and the divergence has yet to be resolved)
However, our near-term trend bias is higher in index while above 1947
A close over 1989 is needed to confirm a resumption of the broader trend
A minor cycle turn window is eyed later next week
A daily close under 1947 will turn us negative on the S&P 500
S&P 500 Strategy: Like holding only small long positions here. Will look to trade from the short side if 1947 gives way on a closing basis.
Focus Chart of the Day: FXCM US Dollar Index
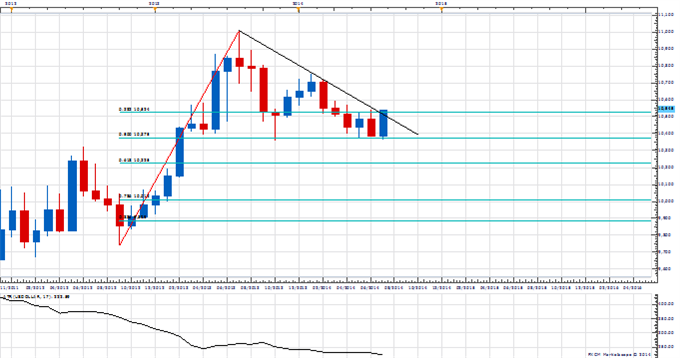
It is the last trading day of the month and several markets we track are on the cusp of putting in some important patterns on the monthly. Perhaps the most interesting is the FXCM US Dollar Index (equally weighted basket of USD against EUR, JPY, GBP & AUD) which if things stay as they are for a few more hours will complete a key reversal/outside month. This is a pretty bullish medium/long-term omen, but even more so when you take into account that the reversal at the beginning of the month came right off the 50% retracement of the 2012/2013 advance. It is also worth noting that a close around current levels could also be interpreted as a breakout from a year-long continuation pattern as the index will have overcome the trendline connecting the July 2013 & January 2014 highs. All things considered, the USD clearly looks to be gearing up for a strong second half of the year. Something the longer-term cyclical picture seems to support. In my experience, however, such widely patterns don’t usually work right away as there is often a pullback period after technicians like myself hype the monthly patterns. Such an occurrence looks possible this time as a short period of weakness is favored after the cycle turn window next week.
To receive Kristian’s analysis directly via email, please SIGN UP HERE.
This publication attempts to further explore the concept that mass movements of human psychology, as represented by the financial markets, are subject to the mathematical laws of nature and through the use of various geometric, arithmetic, statistical and cyclical techniques a better understanding of markets and their corresponding movements can be achieved.
— Written by Kristian Kerr, Senior Currency Strategist for DailyFX.com
To contact Kristian, e-mail kkerr@fxcm.com. Follow me on Twitter @KKerrFX
Price & Time: The Longer-Term Implications of Recent USD Strength
No comments:
Post a Comment