To receive Ilya’s analysis directly via email, please SIGN UP HERE
Talking Points:
GBP/USD Technical Strategy: Flat
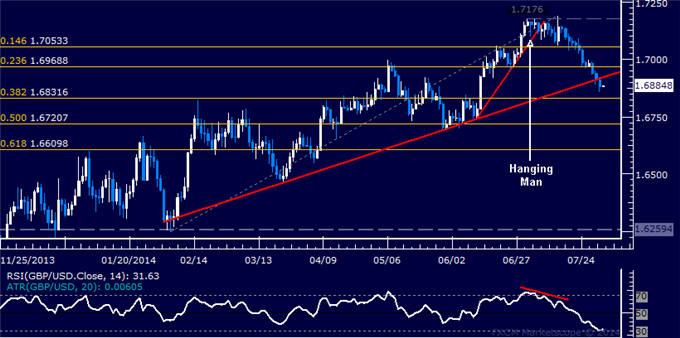
Support: 1.6832, 1.6721, 1.6610
Resistance:1.6919, 1.6969, 1.7053
The British Pound renewed its push lower against the US Dollar having reversed downward as expected after putting in a Hanging Man candle with negative RSI divergence. A daily close below support 1.6831, the 38.2% Fibonacci retracement, exposes the 50% level at 1.6721.Alternatively, a bounce above support-turned-resistance ata rising trend line set from early February (now at 1.6919) clears the way for a challenge of the 23.6% Fib at 1.6969.
While entering a short position here is tempting, we will tactically opt to stand aside. We already hold long USD exposure against the Euro and the Canadian Dollar. As such, we think it best not to over-commit as heavy-duty US event riskcontinues cross the wires through the week-end.
Add these technical levels directly to your charts with our Support/Resistance Wizard app!
Daily Chart – Created Using FXCM Marketscope 2.0
— Written by Ilya Spivak, Currency Strategist for DailyFX.com
GBP/USD Technical Analysis: Passing on Short Trade Setup
No comments:
Post a Comment