Talking Points:
US Dollar Hits 7-Week High as Pivotal News Looms Ahead
S&P 500 Sellers Challenge Three-Month Uptrend Boundary
Crude Oil at Chart Support, Gold in Consolidation Mode
Can’t access the Dow Jones FXCM US Dollar Index? Try the USD basket on Mirror Trader. **
US DOLLAR TECHNICAL ANALYSIS – Prices broke above yet another layer of resistance after reversing upward as expected having put in a Bullish Engulfing candle pattern. Near-term resistance is at 10513, the 38.2% Fibonacci retracement. A daily close above that exposes 50% level at 10560. Alternatively, a turn back below horizontal pivot support at 10481 opens clears the way for a test of 10456, the intersection of the 23.6% Fib and a rising trend line set from the July 1 low.
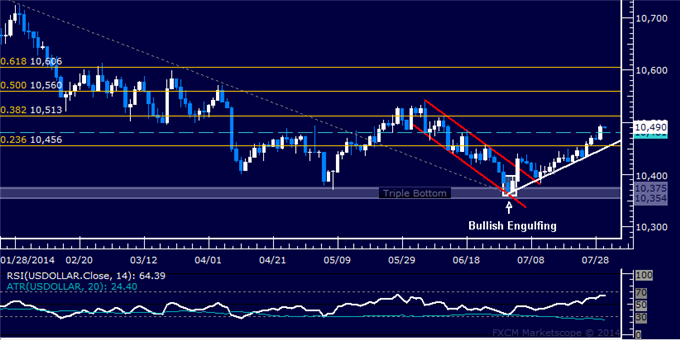
Daily Chart – Created Using FXCM Marketscope 2.0
** The Dow Jones FXCM US Dollar Index and the Mirror Trader USD basket are not the same product.
S&P 500 TECHNICAL ANALYSIS – Prices put in a bearish Evening Star candlestick pattern, hinting a move lower may be ahead. Negative RSI divergence bolsters the case for a downside scenario. A daily close below rising channel floor support at 1970.70 exposes the 23.6% Fibonacci retracement at 1948.40. Near-term resistance is at 1991.40, the July 24 high.

Daily Chart – Created Using FXCM Marketscope 2.0
GOLD TECHNICAL ANALYSIS – Prices are drifting cautiously lower having topped below $1350/oz three weeks ago. Near-term support is in the 1283.07-87.13 area, marked by a falling trend line set from late June and the 38.2% Fibonacci expansion. A break below that on a daily closing basis exposes the 50% level at 1269.22. Alternatively, a reversal above the 23.6% Fib at 1309.20 eyes the 14.6% expansion at 1322.94.

Daily Chart – Created Using FXCM Marketscope 2.0
CRUDE OIL TECHNICAL ANALYSIS – Prices edged below support at 101.87, the 23.6% Fibonacci expansion, exposing the 38.2% level at 100.61. This barrier is reinforced by a rising channel floor at 100.31. A break below that on a daily closing basis eyes the 50% Fib at 99.58. Alternatively, a turn back above 101.87 eyes the July 18 highat 103.91.

Daily Chart – Created Using FXCM Marketscope 2.0
— Written by Ilya Spivak, Currency Strategist for DailyFX.com
To receive Ilya’s analysis directly via email, please SIGN UP HERE
Contact and follow Ilya on Twitter: @IlyaSpivak
Crude Oil, SPX 500 at Trend Support Before Critical US Event Risk
No comments:
Post a Comment