Talking Points:
US Dollar Tags 4-Month High as Rebound Gains Traction
S&P 500 Flirts with Trend Reversal at Pivotal Channel Floor
Crude Oil Breaks 4-Month Uptrend, Slips Below $100 Mark
Can’t access the Dow Jones FXCM US Dollar Index? Try the USD basket on Mirror Trader. **
US DOLLAR TECHNICAL ANALYSIS – Prices continue to advance as expected after putting in a Bullish Engulfing candle pattern at support set from October 2013. A daily close above the 38.2% Fibonacci retracement at 10513 has exposed the May 28 high at 10531. Pushing further beyond that targets the 50% level at 10560. Alternatively, reversal back below 10513 opens the door for a challenge of a horizontal pivot at 10481, followed by the intersection of a rising trend line set from the July 1 low and the 23.6% Fib at 10456.
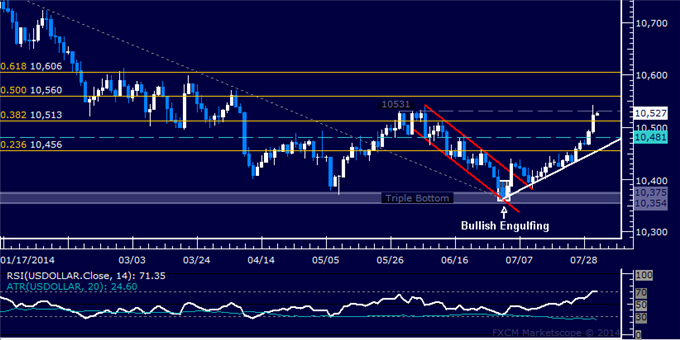
Daily Chart – Created Using FXCM Marketscope 2.0
** The Dow Jones FXCM US Dollar Index and the Mirror Trader USD basket are not the same product.
S&P 500 TECHNICAL ANALYSIS – Prices are probing lower as expected after putting in a bearish Evening Star candlestick pattern bolstered by negative RSI divergence. A daily close below a rising channel floor set from mid-April, now at 1971.70, exposes the 23.6% Fibonacci retracement at 1948.40. Near-term resistance remains at 1991.40, the July 24 high.
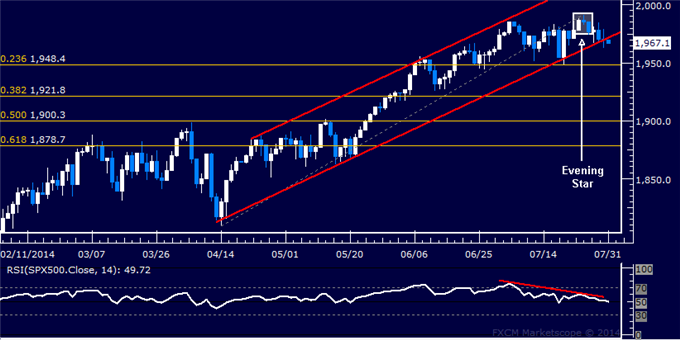
Daily Chart – Created Using FXCM Marketscope 2.0
GOLD TECHNICAL ANALYSIS – Prices are drifting cautiously lower having topped below $1350/oz three weeks ago. Near-term support is in the 1282.35-87.13 area, marked by a falling trend line set from late June and the 38.2% Fibonacci expansion. A break below that on a daily closing basis exposes the 50% level at 1269.22. Alternatively, a reversal above the 23.6% Fib at 1309.20 eyes the 14.6% expansion at 1322.94.
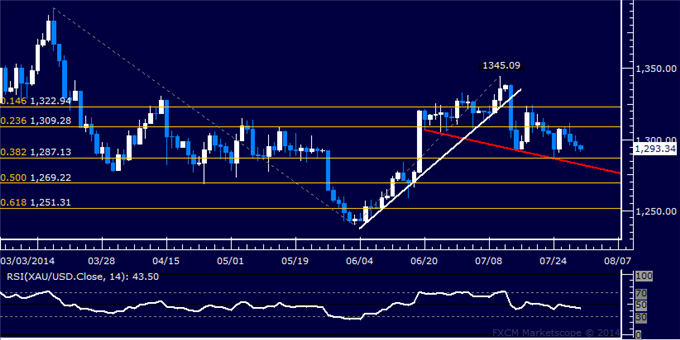
Daily Chart – Created Using FXCM Marketscope 2.0
CRUDE OIL TECHNICAL ANALYSIS – Prices crashed through rising channel support set from mid-March and narrowly pierced the 50% Fibonacci expansion at 99.58. Sellers now aim to challenge the July 15 low at 98.99, followed by the 61.8% level at 98.56. Alternatively, a turn back above 99.58 opens the door for a retest of the channel floor, now at 100.34.
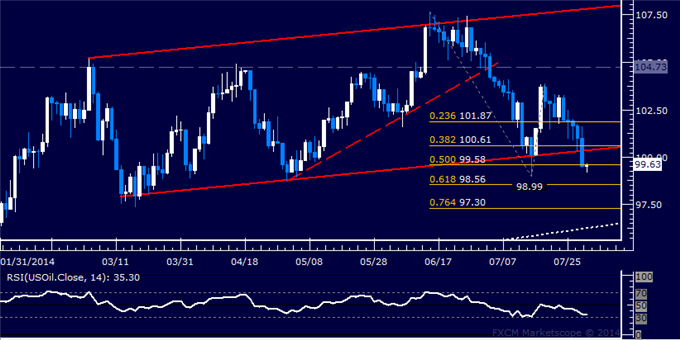
Daily Chart – Created Using FXCM Marketscope 2.0
— Written by Ilya Spivak, Currency Strategist for DailyFX.com
To receive Ilya’s analysis directly via email, please SIGN UP HERE
Contact and follow Ilya on Twitter: @IlyaSpivak
Crude Oil Loses Grip on $100 Figure, US Dollar Rebound Accelerates
No comments:
Post a Comment